Response Rate Chart
This basic chart can display the overall response rate over time. It is also
possible to plot specific error codes, such as NOERROR.
$ tools/plot-response-rate.py -r 0 -o rr.png UDP.json
Tip
The image format depends on the output filename extension chosen with can
-o/--output. svg is used by default, but other formats such as png
are supported as well.
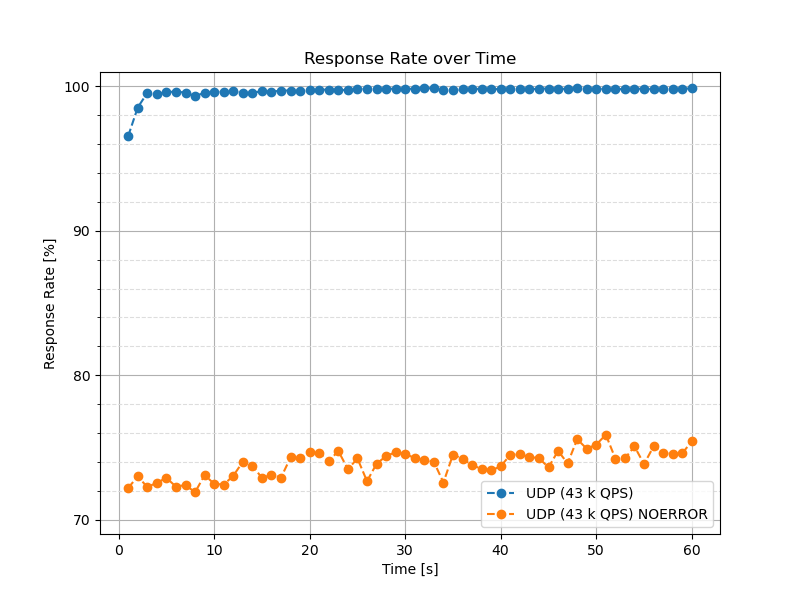
The following chart displays the answer rate and the rate of NOERROR answers.
In this measurement, the resolver was started with a cold cache. We can see the
overall response rate is close to 100 %. The NOERROR response rate slightly
increases over time from 72 % to around 75 % as the cache warms up.