Analyzing Clients
When you've created a pellets file that is ready to use for DNS Shotgun replay, you may want to verify you didn't distort the original client population. There is a tool that can be used to compare client distribution and activity between the original traffic capture and the pellets file.
Note
This steps is optional and may not be neccessary for larger client populations or for client populations with similar behaviour. Nevertheless, it's better to check your assumptions.
First, you need to run client analysis script for both the original capture (or
rather the filtered.pcap file) and the processed pellets file.
$ pcap/count-packets-per-ip.lua -r filtered.pcap --csv filtered.csv
$ pcap/count-packets-per-ip.lua -r pellets.pcap --csv pellets.csv
Then, you can use another tool to plot a chart of these results.
$ tools/plot-client-distribution.py -o clients.png filtered.csv pellets.csv
Client distribution chart
The following charts demonstrates how queries are distributed among clients. It can be used to read how active are your clients or how many overall queries your resolver receives from which clients.
Warning
The following chart displays absolute number of queries, not QPS. When comparing multiple distributions, always make sure to use PCAPs of the same duration.
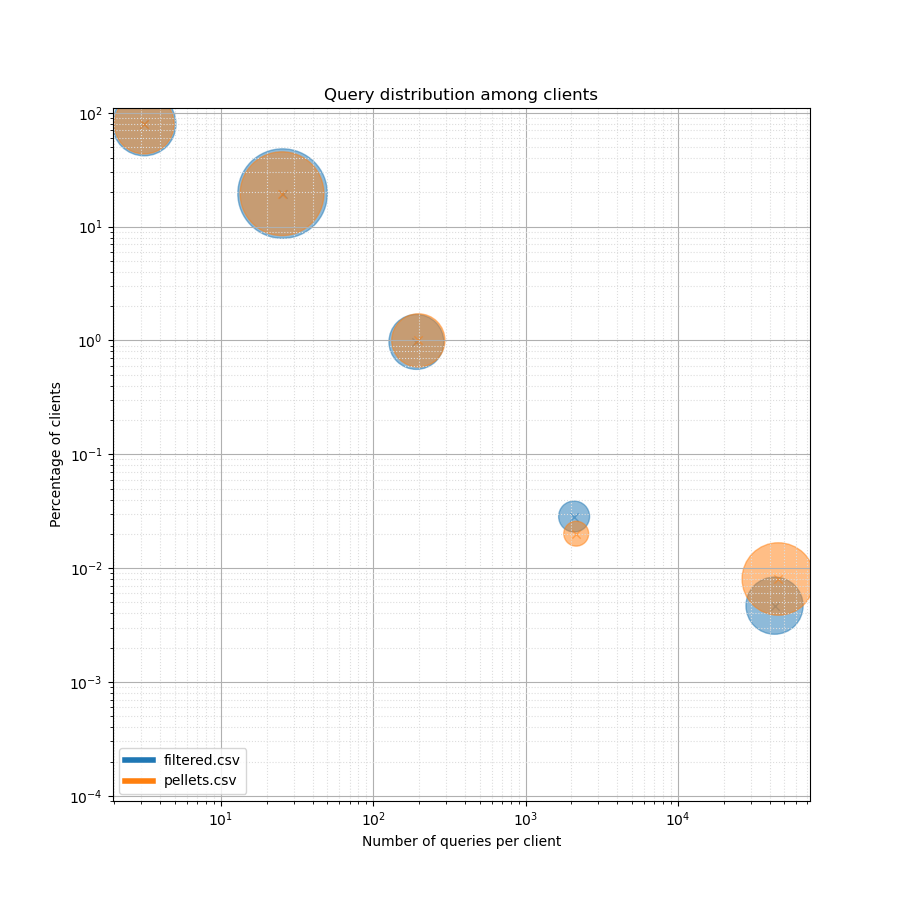
There are several blobs on the chart that represent groups of clients. The area of the blob visually signifies the total amount of queries that were received from these clients.
For each blob, you can locate its center and read the X and Y axes values. Please note that both axis are logarithmic. On the Y-axis you can read the mean number of queries that a client represented in the blob has sent. On the X-axis, you can read the percentage of clients that are represented by this blob.
In the example above, the first blob from the left shows that almost 80 % of clients send less than 10 queries. Around 20 % of clients send between 10 and 100 queries. Even though the remaining clients represent around 1 % of the total client population, we can see that these clients generate significant query traffic.
The comparison shows the two samples are quite similar. In case these
differences are significant, you may want to consider changes to pellets files.
If you used pcap/limit-clients.lua to generate these, using a different
-s/--seed might help.